
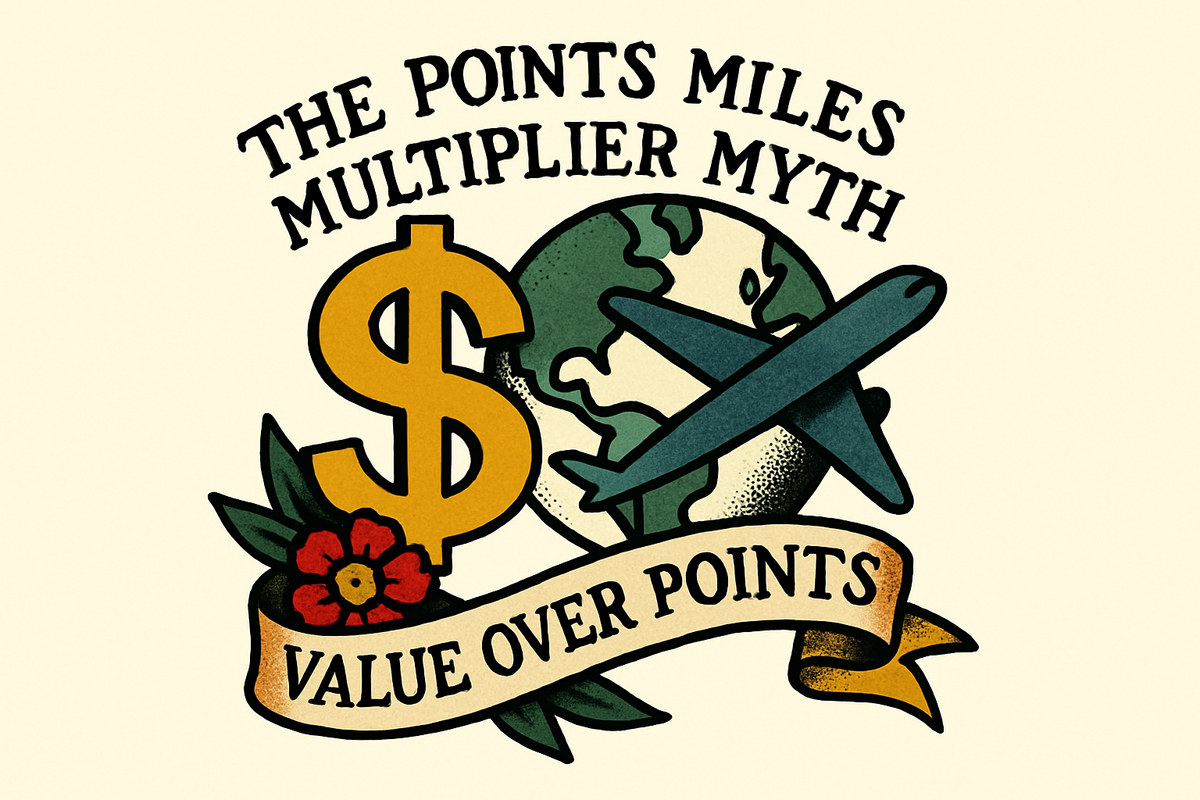
The Miles Multiplier Myth: Why “Double Points” Isn’t Always Double Value
“Double points” sounds like a win. It’s not. Most multipliers are smoke and mirrors - inflated earn rates hiding weak redemptions. The real metric isn’t 2x or 5x. It’s Return on Spend - what your dollar actually yields when you cash those points for real value, not brochure math.

If You Only Had 60 Seconds to Read This Article
| Click Here 🤏🏻
The game isn’t about how many points you earn - it’s about what they’re worth when you redeem them. Credit card multipliers like 2x or 3x sound powerful, but they often mask redemption rates so weak that your actual return on spend barely cracks 2%.
A true points strategist doesn’t chase category bonuses. They chase value per point. That means understanding the difference between fixed-rate and transferable currencies, between hotel points worth half a cent and airline miles worth two. The more flexible the ecosystem, the higher the leverage.
“Double points” on gas or dining can be worse than “single points” on transferable spend if your redemption power is capped. Marketing math wants you to see velocity; financial math demands you see yield. The distinction is what separates redemptions that feel free from those that barely move the needle.
At UpNonStop, we measure in Return on Spend - not x-multipliers. Because the only number that matters isn’t how fast you earn points; it’s how effectively those points pay you back.
Everything else you need to know is just below 👇🏻
🎞️: Powered by NotebookLM @ UpNonStop
“Earn 2x on dining! 3x on travel! 5x on gas!”
The siren song of bonus multipliers has trained us to chase the flashiest number. The problem? Those numbers rarely mean what they seem. A 2x category bonus might not even beat a 1x card if your redemption strategy is weak - or worse, if your points are trapped in a program with poor transfer value.
The truth is, “double points” isn’t double value. In many cases, it’s a distraction that hides the real math behind your Return on Spend - the only number that actually matters.
Below, we’re dismantling the illusion of the multiplier and exposing how marketing inflates perception while compressing yield. You’ll see why your “double points” might be barely worth 1.2x in real-world value - and how to flip that illusion into leverage.
The Illusion of the Multiplier
Credit card marketing thrives on psychological shorthand. Consumers don’t want to calculate, they want to feel like they’re winning. “2x” creates an instant dopamine hit: twice as many points! twice as much value! Except… not really.
Take a typical setup:
- Card A earns 1x transferable points redeemable for ~2 cents per point (CPP) when used for premium travel redemptions.
- Card B earns 2x fixed-value points, worth exactly 1 cent per point when redeemed through the bank’s portal.
Which one wins?
Card A yields 2% Return on Spend (1x × $0.02).
Card B yields 2% Return on Spend (2x × $0.01).
They’re identical. The “double points” advantage collapses instantly when you translate points into redemption value.
Now factor in flexibility, transfer partners, and redemption quality - and the 1x earner often wins. Why? Because the earn rate means nothing without a burn rate that multiplies it effectively.
Understanding Return on Spend
This is where most cardholders (and even most blogs) get it wrong. They obsess over earn rates and ignore Return on Spend - the metric that actually defines how well you’re playing the game.
Return on Spend = (Points Earned × Redemption Value) ÷ Total Spend
It’s the true yield of your card strategy, a measure of how efficiently you’re converting expenses into real-world travel value.
Example:
If you earn 3x points on dining but redeem those points for 1 cent each, you’re getting a 3% return.
If you earn 1x transferable points but redeem at 4 cents per point through a premium flight, you’re getting a 4% return - on every dollar, across every category.
In other words, the redemption engine drives the earn engine. You can’t optimize one side without the other. High earn rates on low-value points are like sprinting on a treadmill - you’re working hard but going nowhere.
Why 3x Isn’t Always 3x (and Sometimes Not Even 2x)
Here’s a classic trap: the category bonus illusion. You see a 3x multiplier and assume that means you’re tripling your outcome. But let’s translate that into Return on Spend.
| Card | Category | Multiplier | Point Value (CPP) | Return on Spend |
|---|---|---|---|---|
| Chase Sapphire Preferred | Dining | 3x | 1.25¢ | 3.75% |
| Amex Gold | Dining | 4x | 1.8¢ (average MR transfer) | 7.2% |
| Capital One Venture | Everything | 2x | 1¢ | 2% |
| Citi Custom Cash | Dining | 5x | 1¢ | 5% |
Looks great on paper, right? But only if you redeem efficiently.
If you cash out those Amex points at 1 cent per point through the portal instead of transferring them strategically, your 7.2% collapses to 4%. If you carry a Venture card but never redeem for travel, your “2x” might effectively become 0.8x after poor redemptions or inflated dynamic pricing.
The math always collapses to one question: what’s your redemption strategy worth per point? Without that, 3x is just marketing noise.
The Redemption Penalty
Every point program hides a redemption penalty - a quiet haircut applied at the back end of your journey. Sometimes it’s overt (fixed-value redemptions). Sometimes it’s invisible (dynamic pricing).
Let’s break down the three main penalties:
- Fixed-Value Redemption:
Every point is worth exactly 1 cent, no matter how you use it. Common with Capital One, some Citi cards, and co-branded hotel programs. - Dynamic Pricing:
Airlines price awards based on cash value, so your redemption power drops when fares spike. This is now the dominant model across Delta, United, and Southwest. - Transfer Partner Dilution:
Even if you can transfer to partners, bad timing or poor inventory can drop the effective value per point below expectations.
Here’s the kicker: a 2x earn rate with a 50% redemption penalty is functionally the same as 1x with full value. The illusion of earning fast collapses under the weight of redemption friction.
You can only multiply value that actually exists.
The True Power of Transferable Points
Transferable currencies (Amex Membership Rewards, Chase Ultimate Rewards, Citi ThankYou, Capital One Miles, Bilt Points) break the illusion because they give you options.
A fixed-value card might show you “5x on gas,” but every point you earn is chained to a portal worth 1 cent. A transferable card at 2x with 2-cent redemption potential doubles your outcome, even though it looks weaker on the surface.
That’s the paradox: weaker earn rate, stronger yield.
The highest-performing portfolios don’t chase 5x categories - they chase flexibility and liquidity. That’s what turns every dollar of spend into a strategic lever instead of a rebate.
The Business Illusion: Small and Medium Businesses and the 5x Trap
For small and medium business owners, the illusion grows even more expensive. Most business cards dangle “5x on office supply stores” or “3x on travel,” but the companies that actually spend millions don’t see those categories in proportion.
A marketing agency spending $2 million a year might have:
- $1.4M in ad spend (usually 1x category)
- $300K in contractor payments (1x)
- $150K in travel (3x)
- $150K in miscellaneous (1x-2x)
On paper, they’re “earning multipliers.” In reality, 80% of spend sits at 1x. Even if 20% earns 3x, the total weighted average is closer to 1.4x overall.
Now look at redemption: If they’re redeeming for flights at 1.2 cents per point instead of optimized 2.0-3.0, the business’s Return on Spend collapses from a theoretical 4.2% to a real 1.7%.
That’s the multiplier myth in its most dangerous form: illusions scaled by volume.
When the Math Comes Alive: A Real-World Example
Let’s put numbers to it...
Scenario A: Restaurant owner puts $500,000 annually on a 4x "Internet Advertising” Amex Business Gold card
At 4x, they earn 2,000,000 MR points.
If redeemed at 1 cent per point, that’s $20,000 in value (4% return).
If transferred strategically to Air Canada or ANA and redeemed at 3 cents per point, that’s $60,000 in premium travel value (12% Return on Spend).
Scenario B: Similar restaurant owner uses a flat 2x cash back card on the same spend
They earn $10,000 in cash (2% return).
Same category, same spend, radically different yield.
The multiplier didn’t make the difference - the redemption strategy did.
Why the Industry Wants You to Stay Blind
Card issuers know the average consumer doesn’t do this math. They rely on it. The entire credit card ecosystem runs on breakage: unredeemed points, low-value redemptions, and misaligned strategies.
Every time someone redeems through a bank portal instead of transferring, the bank’s cost per point drops. Every time you chase a “3x category” and forget to optimize redemptions, you’re subsidizing the marketing promise.
That’s why marketing screams “5x on dining” while whispering “fixed 1 cent value.” It’s sleight of hand disguised as generosity.
The Strategic Inversion: Earning Less, Gaining More
The smartest earners don’t maximize multipliers - they maximize leverage. That means:
- Consolidating spend into transferable ecosystems.
- Redeeming at 2-5 cents per point, not 1.
- Tracking Return on Spend across every dollar.
For instance:
A single Amex Platinum earning 1x everywhere can outperform a 5x co-branded hotel card if you redeem strategically. 1x × 4¢ = 4%. 5x × 0.6¢ = 3%.
Less flash. More yield.
That’s the UpNonStop ethos: control the backend, not the billboard.
The Redemption Economy: Your Personal Exchange Rate
Think of every point currency as its own economy, with its own exchange rate. The earn rate is your “income.” The redemption value is your “foreign exchange.”
Earning 3x points in a weak economy (like a fixed-value ecosystem) is like earning Venezuelan bolívars - it looks big until you try to spend it. Earning 1x in a strong economy (like Amex or Chase transfers) is like holding U.S. dollars - it buys you real power anywhere in the world.
The key is to treat every program like a market, not a loyalty plan. You’re not a member. You’re an investor.
The UpNonStop Rule of Real Value
Here’s how we break it down internally when optimizing portfolios:
| Point Type | Typical Earn Rate | Redemption Value | Return on Spend | Notes |
|---|---|---|---|---|
| Fixed-Value (e.g. Capital One, Citi Cash+) | 1–2x | 1¢ | 1–2% | Predictable but capped |
| Airline Co-Brand | 1–3x | 1.2–2¢ | 1.2–6% | Great if loyalty-focused |
| Hotel Co-Brand | 1–6x | 0.5–0.8¢ | 0.5–4.8% | Strong for volume travelers |
| Transferable Ecosystem | 1–4x | 2–5¢ | 2–20% | Peak leverage |
Everything below 5% Return on Spend is passive. Everything above 10% is optimized. Anything in between is where most businesses live - until they start measuring.
Seeing Through the Hype
Every 2x promise, every “bonus category,” every “limited-time multiplier” is a story told by the earn side of the equation. But the real power is on the burn side.
The next time a card promises double points, ask double what? Double of what value?
Because points don’t care how fast you earn them - they care how smartly you spend them.
The Bottom Line: Your Multiplier Doesn’t Matter, Your Math Does
The miles multiplier myth thrives because it’s easy to sell and hard to verify. But once you convert everything to Return on Spend, the illusion collapses.
Every point has a real market value. Every redemption has an opportunity cost. And every card strategy is either compounding leverage - or compounding noise.
The real pros don’t chase 5x. They chase 10-20% Return on Spend.
Because while “double points” sounds good in a headline, compounded value always wins in the fine print.
The SMB Advantage: When You Start Measuring, You Start Winning
For small business owners, the difference between “points” and “profit” is Return on Spend. Once you measure it, you see what was hidden in plain sight: the multiplier game was never meant for scale - it was meant for distraction.
At UpNonStop, we’ve audited thousands of transactions across every industry - construction, accounting, marketing, logistics - and the pattern is identical. The average small / medium business earns a 1.5-2.5% "Return on Spend" before optimization. After restructuring their ecosystem and rethinking redemption, that number routinely jumps to double digits.
That’s not about card choice - it’s about control.
Here’s what happens when you flip the script:
| Industry | Pre-Optimization | Post-Optimization | Lift |
|---|---|---|---|
| Boutique Marketing Firm | 1.8% | 9.2% | +411% |
| HVAC Contractor | 2.1% | 6.8% | +224% |
| Law Office | 2.3% | 10.5% | +356% |
| Accounting Firm | 1.9% | 7.1% | +273% |
| Creative Studio | 2.2% | 12.4% | +464% |
Each of these businesses thought they were “winning” because they had cards that earned 2x, 3x, or 4x on select categories. But until their redemption strategy was centralized and optimized, their effective yield was muted.
Once Return on Spend became their North Star, the multiplier myth died quietly - and profits multiplied for real.
Because here’s the truth no card issuer will print:
Earning 5x means nothing if you’re redeeming at 1x. But earning 1x with 5x leverage changes everything.
That’s how real value compounds. (Or: That’s how our UpNonStop clients fly business or first class while others settles for “bonus points.”)
And that’s why “double points” will never beat measured points.